
The Importance of Feature Scaling When Running PCA
While completing some coursework for undergrad at Virginia Tech, my team and I were studying the opioid epidemic and how we could utilize open source data and machine learning to support public policy decision surrounding the epidemic. A research question we developed was, Is it easy to identify specific counties that are suseptible to a local epidemic occuring(ie a high number of overdose related deaths)? To answer this question, we sought to perform unsupervised machine learning analysis and determine if clustering counties solely based off socioeconomic data from a census would have correlation with opioid abuse deaths. We studied this in the state of Ohio from 2011-2015. Eventually, I will add the full analysis to this blog and my portfolio. However, our group brielfy encounted a problem I do not think is discussed enough when performing a dimension reduction technique such as PCA.
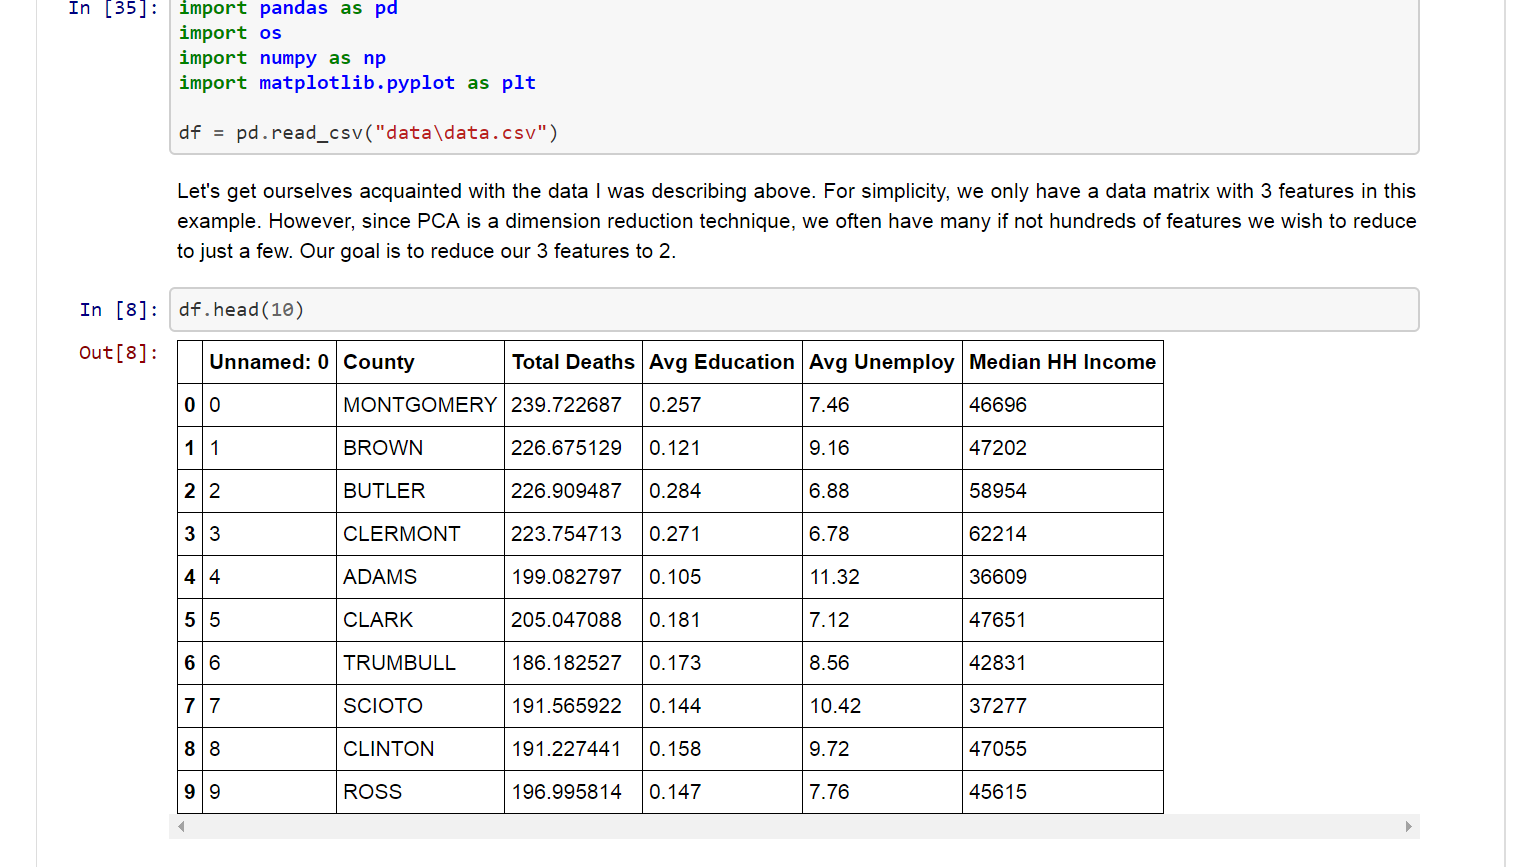
Socioeconomic data often leads to a number of dimensions that have significant multicollinearity present. For example, median household income is typically correlated with the unemployment rate. This is where PCA becomes useful. However, those features are on signficantly different scales. The scaling can lead to the problem of a rank defficient matrix that can “trick” a data scientist when running PCA. In my latest short series post, I have created a Jupyter notebook with a quick fun example from the very project I was working on that I described above(albeit with a trimmed data set for simplicty). I encourage you to check out the notebook here and as always I welcome your feedback.